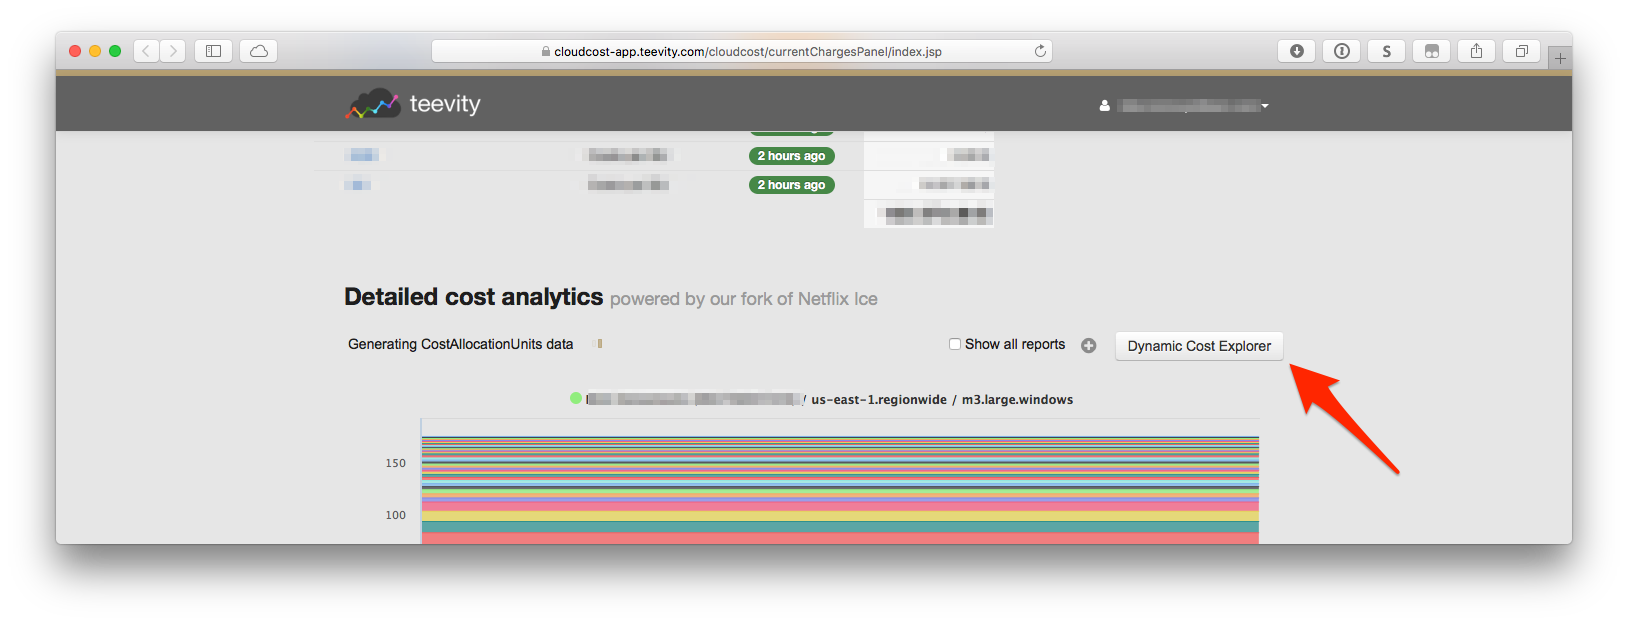
Start Teevity Dynamic Cost Explorer (DCE)
In the "Detailed cost analytics" section, click on the button on the right "Dynamic Cost Explorer". If the DCE hasn't been started for a while you might have to wait few minutes while it loads before using it.
Tools available
Summary
The summary view is a very light report, that sums up your cloud costs for the past month. There is very few options available on this view, but it allow a quick overlook before analyzing in more details.
Note: You can't save this view under reports.
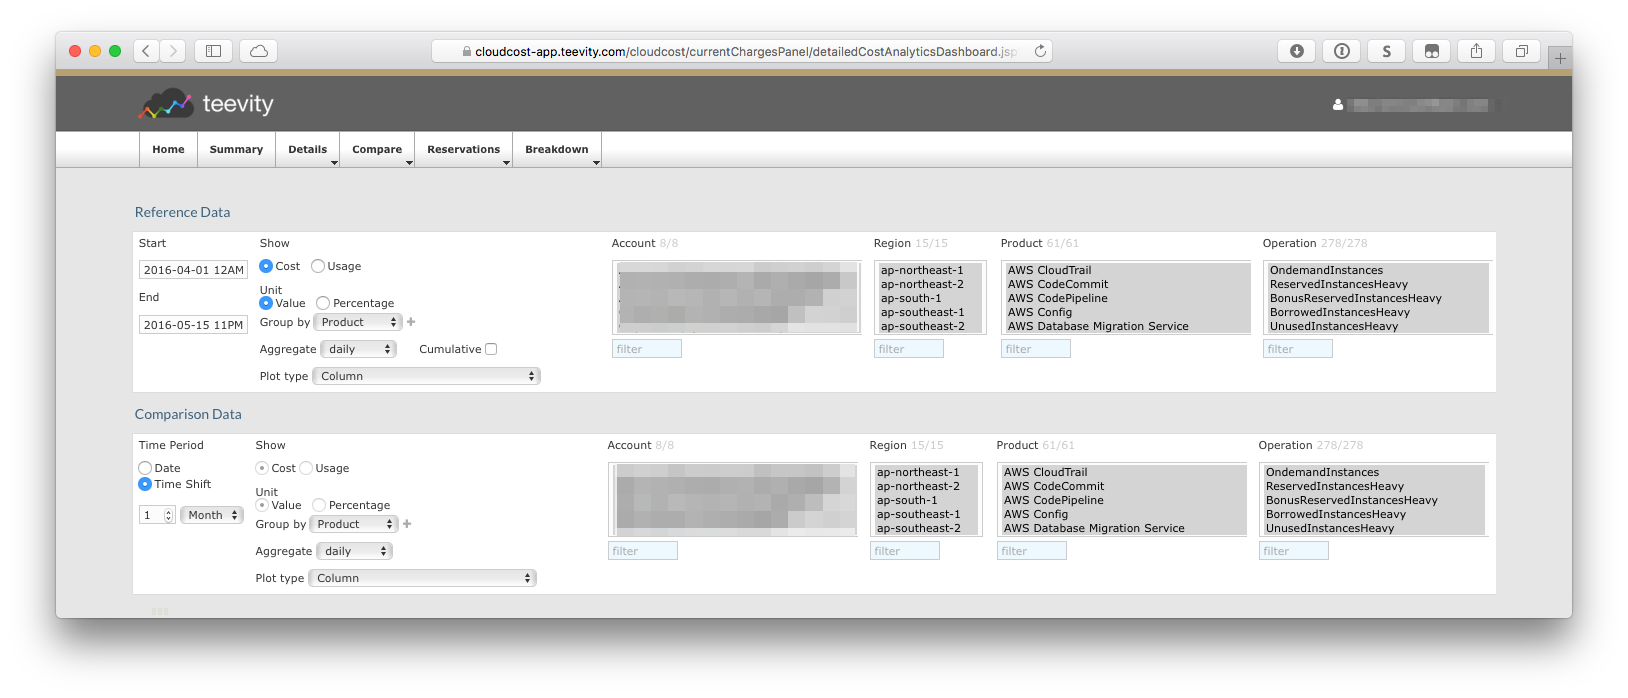
Details
The detail view offers more possibility than the summary view. You can:
- Define a precise period
- Show cost or usage
- Group by multiple attributes
- Aggregate on a given period of time (hourly, daily, weekly or monthly)
- Filter on each attribute
Filter options
Regexp and stuff
Compare
With the compare view you can view the different between two reports. It can be useful in these gieven scenarios:
- Inspect the savings made thanks to RI purchases
- Inspect the savings made thanks to the automated switch-off of resources during out office hours
- Inspect the savings made thanks to an EBS drive size reduction
- Inspect the savings made thanks to the Provisionned IOPS reduction of an a PIOPS EBS drive
You can do that by filtering accounts or CostAllocationUnits. You may also want to filter services (EC2, S3, GCE/GCS, ...) if you think other services might interfere with your comparison
In the reference data, chose which time granularity you want to determine the point-in-time period, and then chose the period of time
Warning
If the point-in-time period you select is smaller than the granularity (ex you have selected a 4h window with a 'Daily' time-granularity) data will be inferred based on this selected period to match.
Reservations
The reservation view can be used to see the RI coverage